 Loading your page…
 jdwin ai engine 1.0 is running now Saudi patent application SA 1020264706 · Pending Registered ownership rights

The first reverse-feasibility study in the world
A new era of successful ventures
Your projects and data are private in jdwin. We use analysis content to train JDWIN's model only after you explicitly enable it in account settings.
70 analysis categories 2,194+ variables The Decisive Call, free
JDWIN reports
Terms Born here, because the method itself is new
“Reverse” means the direction is inverted: from the street to the spreadsheet, not from the spreadsheet to the street
We dissect the site The way your customer sees it, not as it appears on the map
Five layers the engine reads for every site, on scientific foundations and reference measurement — each layer translated into an indicator inside your report

The strength of JDWIN
The site and its access network
The engine draws access routes to the site from real map data, and measures travel time from surrounding districts under globally accepted transport-planning standards
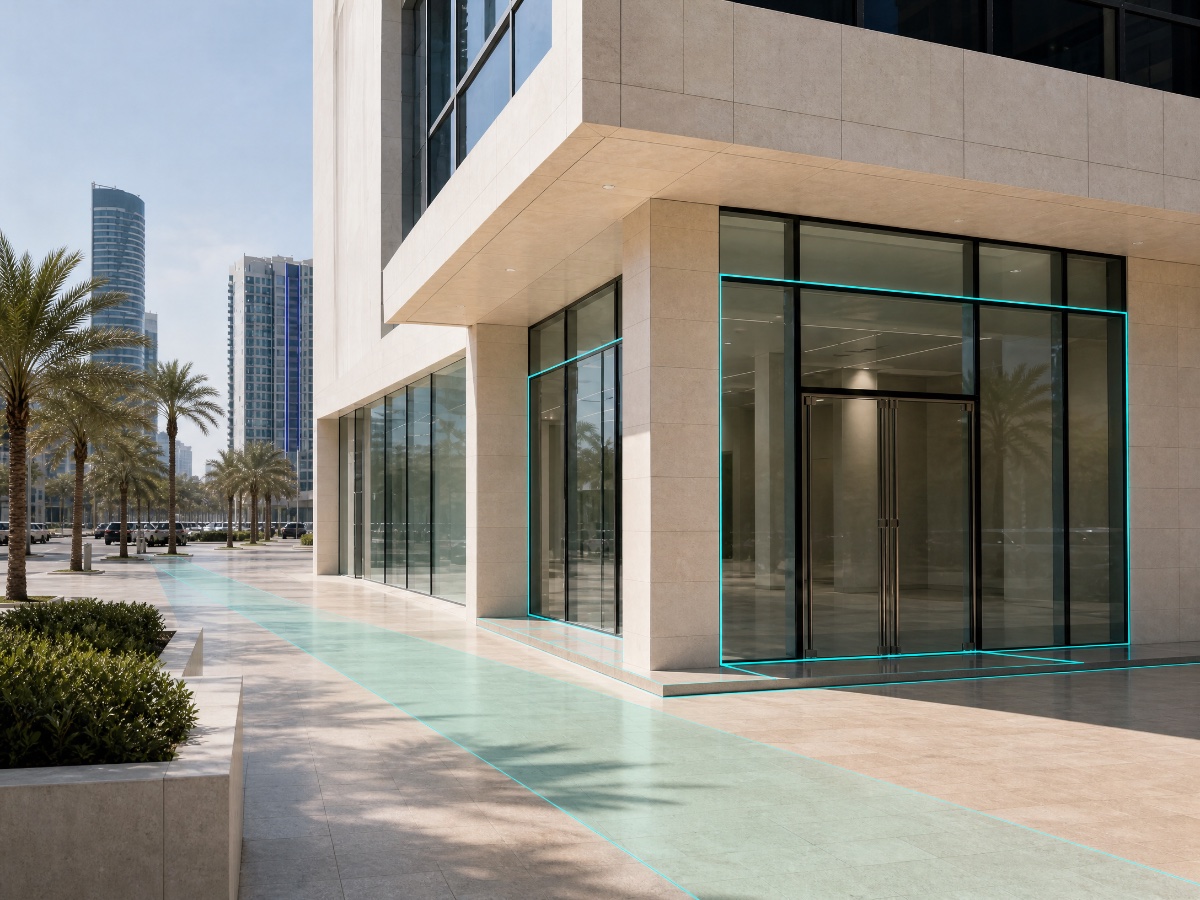
JDWIN's accuracy
Frontage and visibility
Measures the frontage's visibility angle and the sign's readability from driving distance, based on sightline-design standards used in road engineering and traffic safety
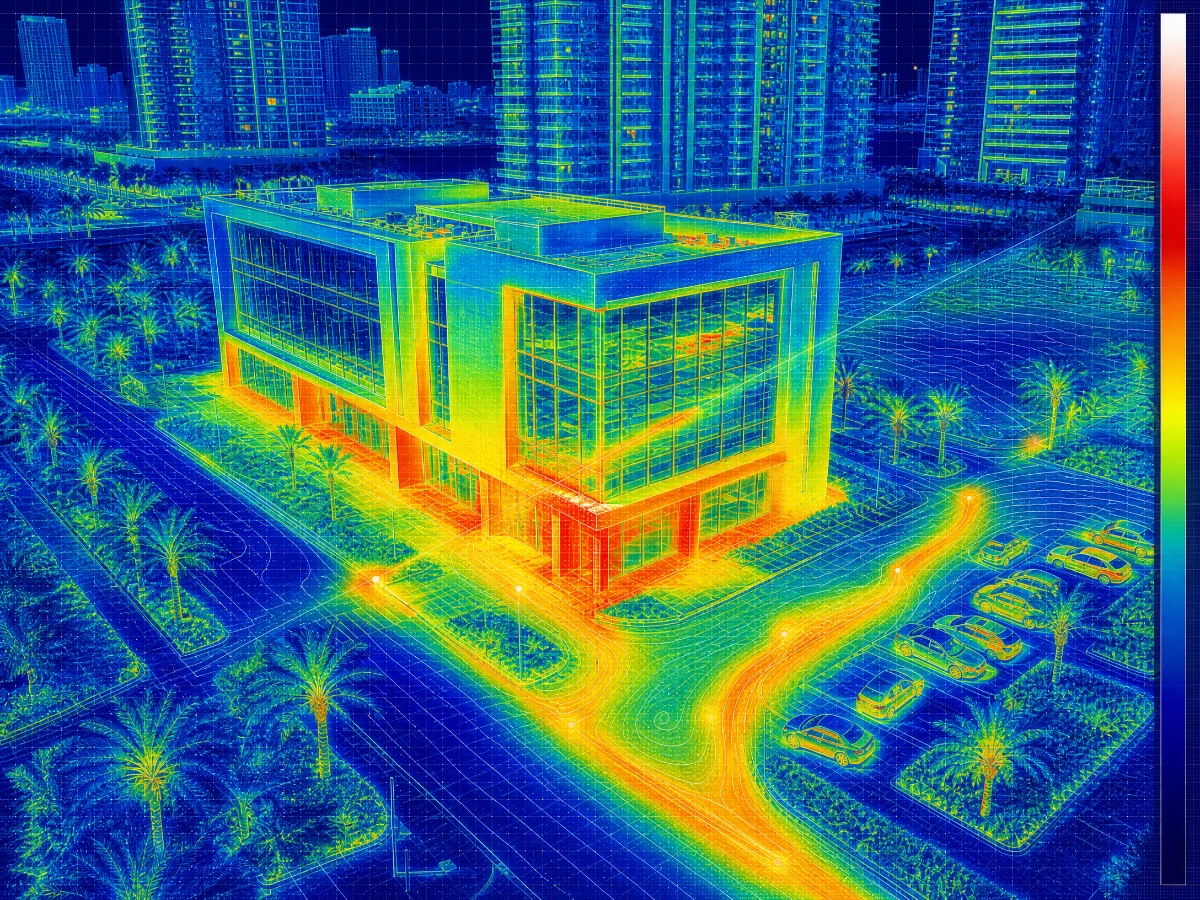
International scientific standards
A source for every figure
JDWIN builds its readings on spatial layers from map data around the site; every figure has its source, and an estimate is marked “estimated”, never presented as a measurement
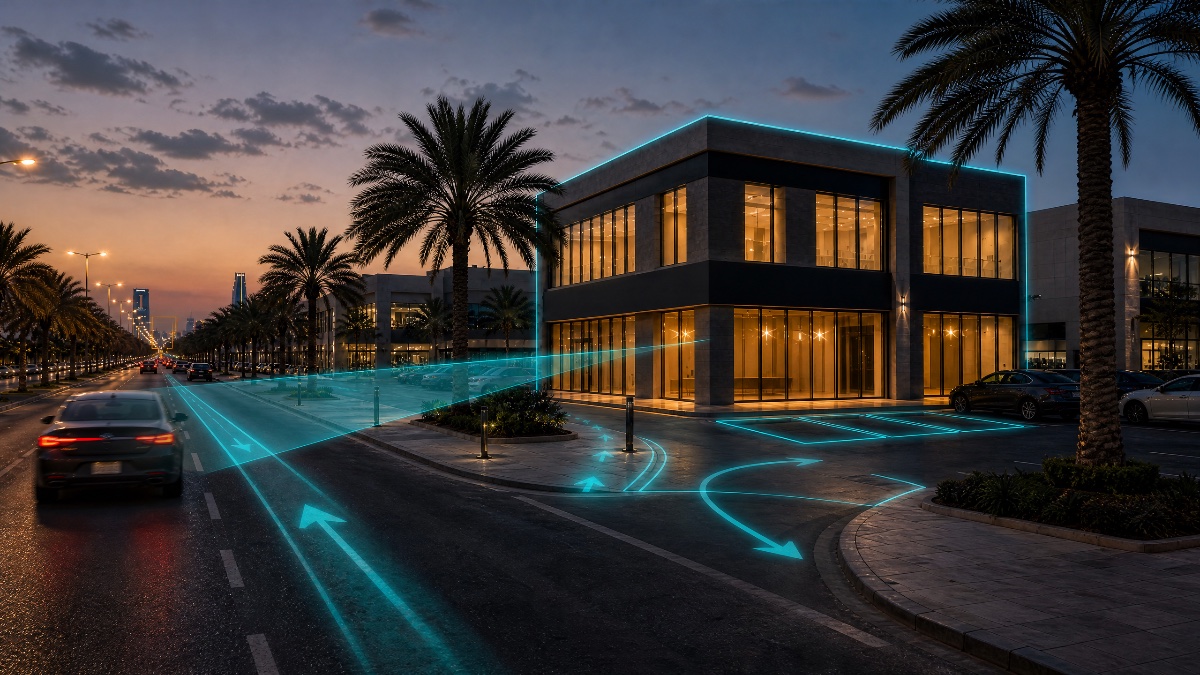
JDWIN features
Access and movement
Reads the road network around the site, its entrances and its proximity to movement corridors, and feeds the access and movement index in the report
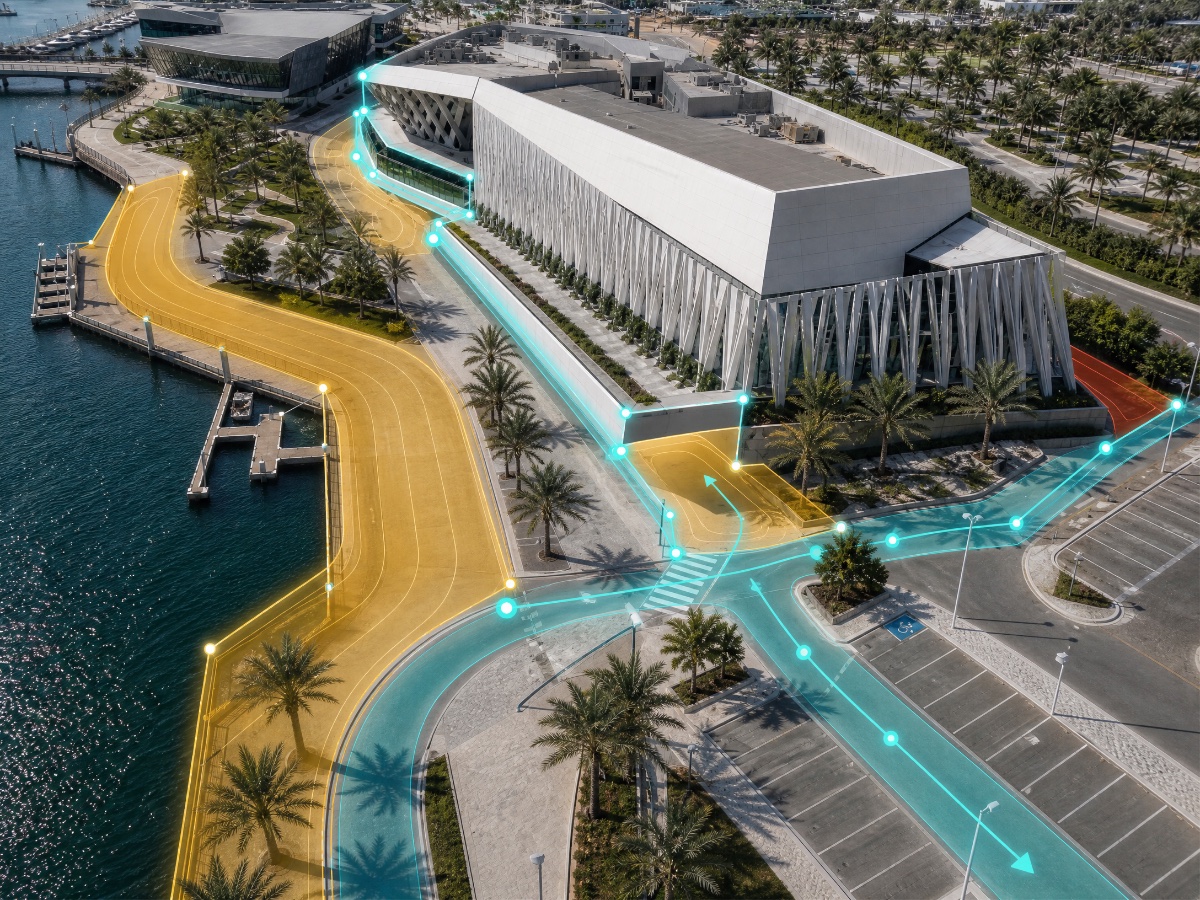
From pixel to decision
Accuracy translated into a decision
Every point on the map becomes a measured coordinate, and five layers meet in one indicator inside your report — not five scattered estimates, but a single judgment built on comprehensive measurement
A network of 1,200+ service From partners and providers
Data providers, operating tools, and publishing channels — the agent reads from them and drafts what gets written to them for you to approve, with permissions you grant and can withdraw whenever you choose
We read demand Before it reaches the market
JDWIN reads reviews from nearby competitors and adds source-cited web research, then extracts measurable signals that feed your report


01 · sources
Illustrative source examples
The icons above are category examples; today's actual reading comes from nearby competitor reviews and source-cited web research
02 · engine
Weighs every signal
Measures engagement, replies, and how often the same request is repeated — so the signal rises from a passing opinion to a weighted figure
03 · exclusive signal
Picks out the decisive signal
Out of thousands of comments, what earns a decision survives: the most engaged-with and most repeated, and it enters your report
Your decision starts from This page
One indicator, a clear decision, and weighted axes — exactly as they appear on the first page of a JDWIN report
Issued by the JDWIN engine RPT-2026-1284
A specialty café around King Saud University
Prince Turki I Street, Al Nakheel District, Riyadh · 300 m from the North Gate 84 /100
Proceed
The decision: Proceed The Proceed band starts at 82
Spatial factors 88
Movement and access 91
Economic factors 84
Weighted demand strength 82
Sections from the report itself
28 sections inside the report — these six, exactly as issued
The Indicator and the decision
One number out of 100, with a clear decision beside it; the Proceed band starts at 82, fixed before the analysis begins
The weighted axes
Four weighted axes: Location 30%, Movement 25%, Economics 25%, Demand 20%
Confidence level
89% confidence, calculated as a weighted average of each figure's confidence by its axis weight — never a blanket estimate
Every figure sourced
Every figure in the report is tied to its source layer and confidence level, so it can be traced and audited, line by line
Discuss your report, Don't just read it
JDWIN knows every figure in your report and where it came from — ask it the way you'd ask a partner who knows the whole file
Ask it about any figure Request an alternative scenario Compare two sites Request a risk-mitigation plan
Ask about any detail in your report





One line, and behind it, a complete engine
Every button on JDWIN's bar performs a specific function in the analysis path — here's the whole thing, taken apart
First on every measure
The feasibility decision is measured by it
A method comparison between what JDWIN delivers and the traditional ways projects are evaluated
JDWIN 
96.4% Traditional consulting firms
88.1% TestFit and similar global tools
72.6% General-purpose AI models
54.7% The share of feasibility-study sections completed in one output, with no later human intervention.
Pay for one report, Or own JDWIN outright
One report as a one-time purchase, or a monthly subscription that unlocks the whole JDWIN system: Jadwil, agents, and skills
Free Start here
0 SAR
No card, no subscription What it includes↳
- Two free reports, no card
- The Decisive JDWIN Indicator out of 100, and a decision grade out of four
- A reading of the site within a 500 m radius
- Tracking surrounding competitors and their distribution
- An initial demand reading for your sector
- An executive summary and the top risks
- A conversation with the JDWIN engine about your result
- Read the Free report section inside jdwin
Two reports Free · no card
Pro For one idea
120 SAR
One-time · 6 reports Everything in Free, plus↳
- 6 full reports
- Includes the Site Probe: access, frontage, and traffic
- Includes a demand breakdown from cited sources
- Includes a competitor table with prices and ratings
- Includes the financial model: costs, returns, and the break-even point
- Includes a monthly projected-revenue estimate
- Upload photos of your site to be read into the analysis
- Edit your inputs and regenerate the result
- Access to JDWIN's extended 28-section reports
6 reports One-time
Max Most chosen
440 SAR
One-time · 10 reports Everything in Pro, plus↳
- 10 full reports
- Includes images of the site from different viewpoints
- Includes a side-by-side comparison of two sites
- Includes an assistant for picking the best site in your city
- Includes supplier analysis and the operating chain
- Includes three scenarios: conservative, expected, and ambitious
- Includes sensitivity analysis, the risk index and recommendations
- Test your pricing against market prices
- Early access to new JDWIN features
10 reports One-time
Ultra For several opportunities
3,800 SAR
One-time · 24 reports Everything in Max, plus↳
- 24 full reports
- Includes portfolio reports: several sites in one report
- Includes ranking your sites from strongest to weakest
- Includes an expansion map and city opportunities
- Includes deep sovereign analysis and the real-estate layer
- Includes tracking how your market's figures change after the report
- Run parallel analyses at the same time
- Full access to everything the JDWIN engine issues
24 reports One-time
EnterpriseOn demand
Enterprise integrations, and a site portfolio in one unified report
ERP and CRM integrations Reports for committees and boards
Questions asked Before the first report
01 What does reverse feasibility mean +
Starting from the ground, not the page: the site, competition and demand are read first, then the numbers are built on what was actually found
02 How the JDWIN Indicator is calculated +
Indicators with stated weights, combined into a score out of 100, with every axis broken down inside the report
03 How confident is the decision +
Every decision shows the data coverage it was built on, and every estimated figure is clearly marked
04 Can I upload a photo of the site +
Yes — upload a photo or take one on the spot, and the frontage, sign, and entrance are read and folded into the analysis results
05 Is the Decisive Call really free +
Yes · two Decisive Call reports free, once per account · packages unlock report depth, comparisons, and export
06 What JDWIN doesn't do +
It never claims absolute certainty, and it never replaces your operating experience — it gives you a sourced reading before you commit